The global online food delivery market hit USD 350.63 billion in 2026 — and it is still climbing. Whether you run a restaurant, operate a delivery platform, or are planning to launch one, these online food delivery statistics tell you exactly where the industry stands, who is winning, and where the next wave of growth is coming from.
This blog will look into the most recent online food delivery statistics, examining important trends, growth figures, consumer preferences, and the industry’s response to the COVID-19 pandemic. Let’s delve into the fascinating ideas and numbers impacting the future of the online meal delivery sector.
As per Statista, the number of users in the Meal Delivery segment is estimated to reach 2.45 billion by 2027. Want to build your own food delivery app?
Online Food Delivery Statistics: The Global Market at a Glance
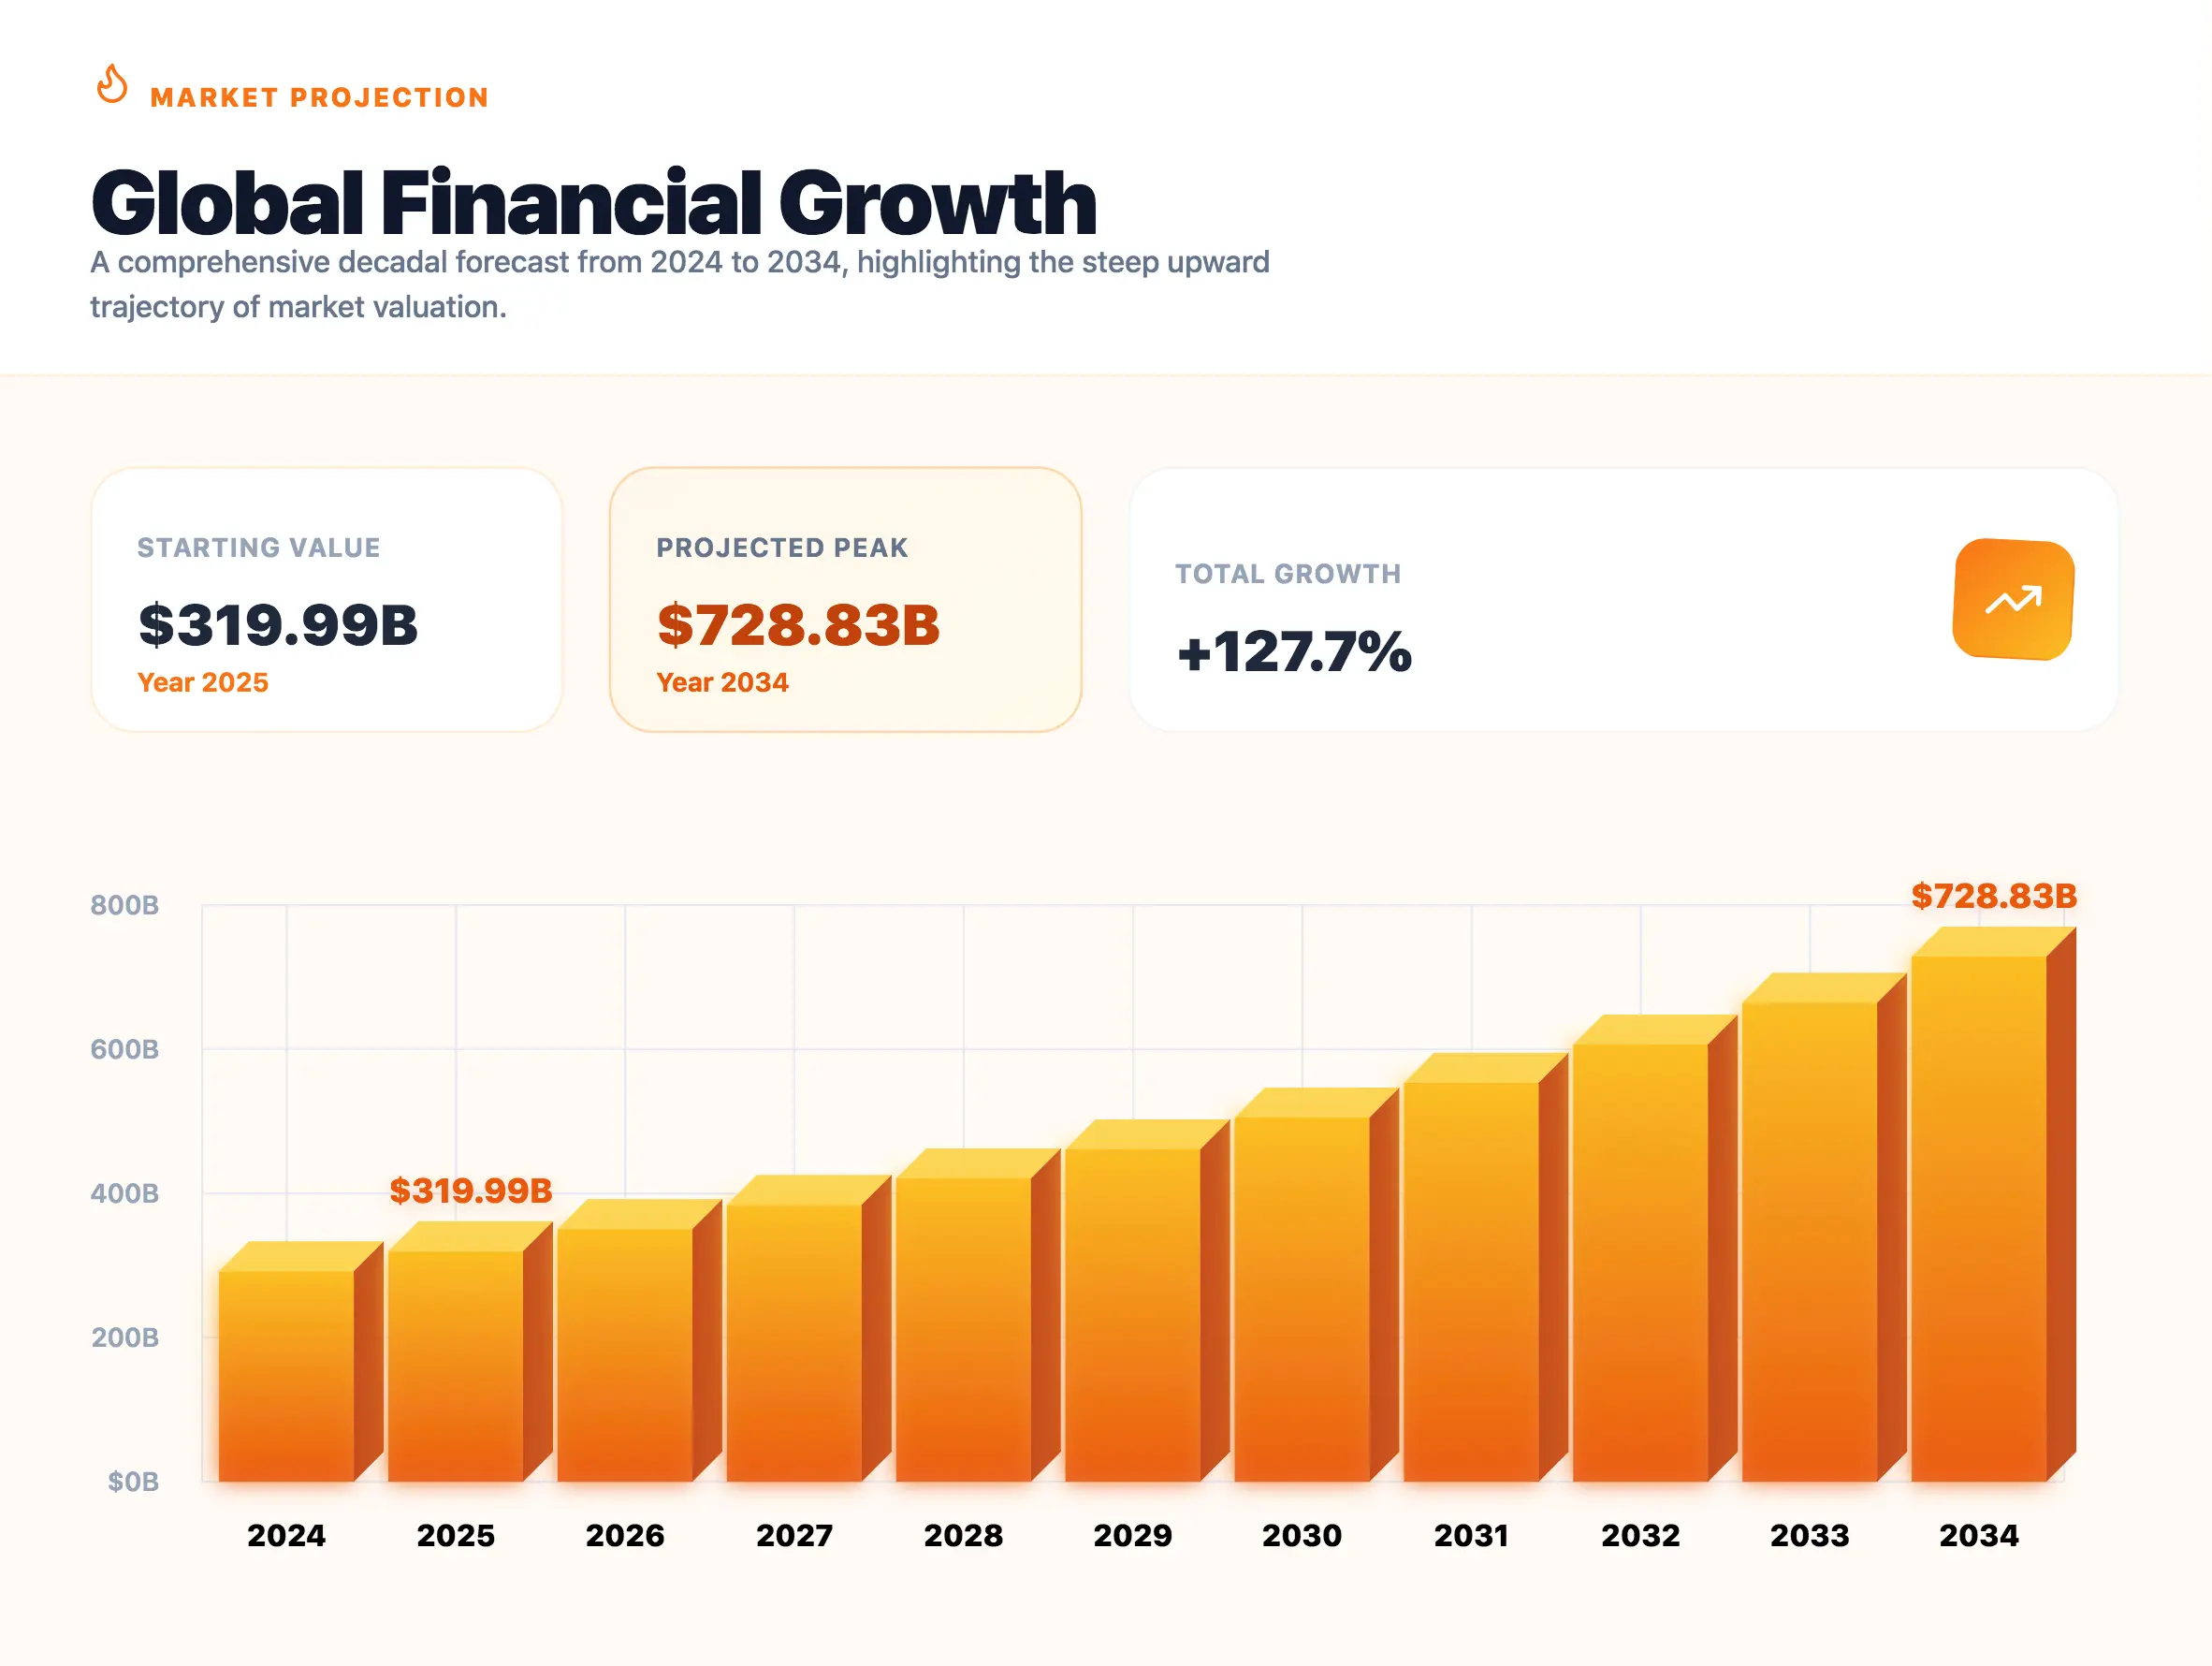
The market has moved well past the pandemic-era surge. According to our research, the global online food delivery market was valued at USD 319.99 billion in 2025 and grew to USD 350.63 billion in 2026, with projections pointing to USD 728.83 billion by 2034 at a CAGR of 9.58%.
When you include both meal delivery and grocery delivery segments together, Statista’s global market forecast puts total online food delivery revenue at USD 1.40 trillion in 2025, growing at a CAGR of 7.63% to reach USD 2.02 trillion by 2030.
Here is what the core numbers look like right now:
- Global market size (2026): USD 350.63 billion (restaurant and meal delivery segment)
- Global market including grocery delivery (2025): USD 1.40 trillion
- Projected market by 2030: USD 2.02 trillion
- CAGR (2026–2034): 9.58%
- Online food delivery users globally: Estimated to reach 2.69 billion by 2026
- Average Revenue Per User (ARPU) in grocery delivery: USD 548.49 in 2025
- Online food ordering growth vs. dine-in since 2014: 300% faster
“These numbers confirm one thing: the industry’s growth is not a blip. It is structural, driven by smartphone adoption, urbanisation, and a generation that simply prefers ordering to cooking.”
Food Delivery App Statistics: Who Controls the Market in 2026?
The food delivery market share battle has been dramatically reshaping itself. 2025 saw some of the most significant consolidation the industry has ever witnessed.
As per our team confirmed that Just Eat was sold to Prosus, Deliveroo was acquired by DoorDash, and Grubhub was sold at a 90% discount on its 2021 peak valuation to Wonder Foods. Three major platforms changed hands in a single year — a sign that profitability, not scale alone, now determines survival.
Here is where the market stands for the dominant players:
United States:
- DoorDash + Wolt hit USD 21.3 billion in order value in Q4 2024, edging past UberEats
US Market Share (2026)
Globally:
- Uber Eats is the most downloaded food delivery app globally, with 88 million users
- Meituan dominates China, the world’s largest single food delivery market at USD 40.2 billion in 2024
- China accounts for over 34% of global online food delivery revenue, with Meituan and Ele.me controlling over 90% of domestic orders
Real Example: DoorDash’s Market Dominance, United States DoorDash grew its US market share from roughly 35% in 2019 to over 67% by 2026 — a gain built on restaurant density, Dashpass subscriptions, and aggressive suburban expansion. In Q4 2024, the company (combined with Wolt) recorded USD 21.3 billion in Gross Order Value, surpassing Uber Eats for the first time at that scale.
The takeaway for restaurant operators: two platforms — DoorDash and Uber Eats — now control 80% of the US market between them. Relying exclusively on either one means accepting their commission terms, their customer relationships, and their rules.
Online Food Delivery Statistics by Region: A Global Breakdown
The online food delivery industry analysis looks very different depending on where you are. Regional dynamics — income levels, smartphone penetration, and local competition — all shape how fast each market grows and who leads it.
Asia-Pacific (34% global share)
Asia-Pacific leads the world in online food delivery revenue, driven by China, India, and Southeast Asia.
China alone generated USD 499.14 billion in grocery delivery revenue in 2025 (Statista).
India’s food delivery market is expanding fast, with platforms like Zomato and Swiggy scaling rapidly. Swiggy’s 2025 launch of Snacc — promising 15-minute snack and beverage delivery in Bengaluru — shows how aggressive the quick commerce push is in this region.
North America (31% global share)
The US is the world’s second-largest food delivery market, generating USD 353 billion in 2024.
The online food delivery industry data analysis looks very different depending on where you are. Regional dynamics — income levels, smartphone penetration, and local competition — all shape how fast each market grows and who leads it.
Asia-Pacific (34% global share)
Asia-Pacific leads the world in online food delivery revenue, driven by China, India, and Southeast Asia.
China alone generated USD 499.14 billion in grocery delivery revenue in 2025 (Statista).
India’s food delivery market is expanding fast, with platforms like Zomato and Swiggy scaling rapidly. Swiggy’s 2025 launch of Snacc — promising 15-minute snack and beverage delivery in Bengaluru — shows how aggressive the quick commerce push is in this region.
North America (31% global share)
The US is the world’s second-largest food delivery market, generating USD 353 billion in 2024.
The average American spends USD 1,850 per year on food delivery, ordering roughly 1.1 times per week. High disposable income, a mature app ecosystem, and strong cloud kitchen infrastructure all support continued growth.
Europe (27% global share)
Europe’s market is shaped by dense urban populations, strong delivery culture in cities like London and Amsterdam, and regulatory pressure on gig-economy labour models.
The UK market in particular benefits from high cultural diversity, fuelling demand for international cuisine delivery. The 2025 DoorDash acquisition of Deliveroo gives DoorDash a powerful European foothold for the first time.
Middle East & Africa (8% global share)
This is the fastest-growing region in percentage terms. Rising smartphone adoption, a young urban population, and expanding delivery logistics infrastructure are accelerating growth across markets like UAE, Saudi Arabia, Nigeria, and South Africa.
Consumer Behavior: What the Online Food Delivery Statistics Actually Tell Us
Numbers about market size matter. Numbers about how actual customers behave matter more — especially if you are planning a delivery business or optimising one you already run.
Here is what the 2025–2026 data shows about real consumer patterns:
Ordering frequency:
- Over 40% of adults order restaurant delivery or takeout 3–5 times per month
- 60% of US consumers order delivery or takeout at least once per week
- 1 in 5 consumers (21%) ordered delivery more frequently in 2025 than the year before
Who is ordering:
- Gen Z (ages 18–24): 59% prefer DoorDash
- Millennials (ages 25–35): 53% use DoorDash
- Urban consumers: Over 40% order delivery at least once per week
- 78% of adults downloaded at least one food-related app in 2025, up from 51% during the pandemic
When and why people order:
- 6pm is the most common order time globally
- Breakfast delivery orders (5–11am) grew 29% in 2024 in the US alone
- 38% of consumers say work is the primary reason they order delivery
- Weekends — especially 5–7pm — remain the peak delivery window
What customers want from the ordering experience:
- 67% of consumers prefer to order directly from the restaurant’s own website or app
- Of those, 61% say it is because they want to support the restaurant directly
- 35% of consumers say low delivery fees are the single most important feature
- 58% expect delivery within 40 minutes or less
- The average delivery window across platforms is approximately 35 minutes; 27% of users say they would pay a premium for faster delivery
These online food delivery statistics point clearly to an audience that is loyal to brands they trust and frustrated by high fees on third-party apps.
The Commission Problem: What Platform Fees Mean for Restaurants
This is the section most statistics blogs skip — and the one restaurant owners most need to see.
Third-party delivery platforms charge restaurants between 15% and 30% commission per order. For a restaurant with thin margins on a USD 20 order, that can mean breaking even or losing money on every delivery placed through DoorDash, Uber Eats, or Grubhub.
Customers feel it too. Some regions have seen a 58% increase in service fees charged to consumers through delivery platforms. That directly impacts order frequency.
The response from operators has been measured but clear:
- 70% of US restaurants now use in-house drivers for at least some of their deliveries
- 67% of consumers prefer ordering directly from a restaurant’s own website or app — meaning customers are actively looking for a way to avoid the platforms
This is why the fastest-growing segment in restaurant tech is direct ordering infrastructure — branded apps, website ordering, and white-label delivery platforms that let businesses own their customer relationships without paying a platform per order.
If you run a restaurant or delivery business and want to explore commission-free ordering, Deonde’s commission-free restaurant ordering system and restaurant delivery app are built specifically to solve this problem.
Quick Commerce, Grocery, and Cloud Kitchen Statistics: The Emerging Growth Engines
The online food delivery market is no longer just about restaurant meals. Three adjacent segments are pulling the industry in new directions.
Grocery Delivery: The grocery delivery segment projected a market volume of USD 943.06 billion in 2025 (Statista), with a 12.4% revenue growth expected in 2026.
Online payment accounts for 68% of all online food delivery transactions globally, driven in part by grocery shoppers who use digital wallets and UPI systems.
For businesses operating in this space, Deonde’s grocery delivery software handles everything from digital storefront to driver dispatch.
Quick Commerce: Sub-hour delivery — sometimes called q-commerce — is the most disruptive trend in the industry right now.
Platforms are investing heavily in dark stores and hyperlocal logistics to compete on delivery speed. BigBasket (under Tata Group) announced plans to roll out a 10-minute hot food delivery service in India by March 2026, using a network of 1,000–1,200 dark stores.
This is no longer a niche experiment. Deonde’s quick commerce software is designed for operators building exactly this kind of operation.
Cloud Kitchens: Cloud kitchens — delivery-only cooking facilities with no dine-in space — have become a mainstream business model, not an experiment.
They allow brands to scale delivery operations with lower real estate costs, test new menus without risk, and serve multiple virtual restaurant brands from a single kitchen. The segment continues to grow as delivery-first consumer habits deepen.
Meal Kit Delivery: Global meal kit delivery revenue is forecast to grow by USD 4.9 billion between 2024 and 2028 — a 33.58% increase. Subscription-based delivery models are proving resilient even as discretionary spending faces pressure in some markets.
Key Online Food Delivery Trends Reshaping the Industry in 2026
The online food delivery trends defining 2026 are a mix of technology shifts, market consolidation, and changing consumer priorities.
AI and Automation in Delivery Operations: Over 60% of restaurants are now integrating AI tools to manage delivery routing, dispatch, and real-time driver tracking.
Route optimisation alone can reduce delivery times by 15–25%, directly impacting customer satisfaction and driver capacity. Deonde’s driver management software uses real-time dispatch logic to maximise delivery efficiency across zones.
Subscription Models: 62% of all food delivery app users globally are now paying for a premium subscription tier. DashPass, Uber One, and similar programmes generate recurring revenue while locking in order frequency.
For independent operators, Deonde’s subscription management feature offers a direct equivalent — customers subscribe, operators retain them.
Alcohol Delivery: Approximately 39% of US consumers report ordering alcohol delivery for parties and celebrations. This segment has moved mainstream since pandemic-era regulatory relaxation. Deonde supports alcohol delivery with age-gating and compliance tools built in.
Market Consolidation Continues: The 2025 consolidation wave — DoorDash buying Deliveroo, Grubhub sold at a 90% discount, Just Eat acquired by Prosus — signals that the era of unprofitable growth is over. Investors want unit economics.
Platforms that cannot demonstrate profitability at scale are either existing or being absorbed. For operators using these platforms, this creates uncertainty. Owning your own online food ordering system becomes a more important hedge every year.
95% of restaurant owners say technology improves the overall efficiency of their operations. The question is no longer whether to invest in delivery tech — it is which platform gives operators the most control.
What These Online Food Delivery Statistics Mean for Your Business
The numbers are consistent across every source: the industry is large, growing, and becoming more competitive at every layer.
Platforms that built their dominance on aggressive subsidies and investor capital are now rationalising. Consumers are ordering more frequently but scrutinising fees more closely. Restaurants are actively looking for ways to reduce dependency on third-party apps.
If you are a restaurant owner, the stat that matters most is this: 67% of consumers already prefer to order directly from a restaurant’s own app or website. The demand for direct ordering is there. The infrastructure to capture it needs to be built.
Deonde helps restaurants and delivery businesses do exactly that — launching branded apps, direct ordering websites, and full delivery management systems without paying per-order commissions. Explore how Deonde works or start a free trial to see the platform in action.

Frequently Asked Questions About Online Food Delivery Statistics
1. How big is the global online food delivery market in 2026?
The global online food delivery market (restaurant and meal delivery segment) is valued at approximately USD 350.63 billion in 2026, according to Fortune Business Insights. When grocery delivery is included, the combined market reaches USD 1.40 trillion (Statista, 2025).
2. Which country has the largest food delivery market?
China is the world’s largest food delivery market by revenue, generating USD 40.2 billion in 2024 from platform-based delivery alone, and over USD 499 billion when grocery delivery is included. Meituan and Ele.me control over 90% of China’s restaurant delivery segment.
3. Which food delivery app has the highest market share in 2026?
In the United States, DoorDash leads with 56% market share, followed by Uber Eats at 23% and Grubhub at 16%. Globally, Uber Eats has the largest number of users outside China, with 88 million active users. Meituan leads in China.
4. What age group orders food online the most?
Gen Z (ages 18–24) and Millennials (ages 25–35) are the most frequent users of food delivery apps. Over 40% of urban consumers in these age groups order delivery at least once per week. The 18–29 age group is consistently the most active delivery demographic across markets.
5.How often do people order food delivery in 2026?
The average US consumer orders food delivery approximately 1.1 times per week — roughly once every 6.7 days. 40% of adults globally order delivery or takeout 3–5 times per month. 60% of US consumers order at least once a week.
6.Why are restaurants moving away from third-party delivery apps?
Third-party platforms charge commissions of 15–30% per order, which significantly reduces restaurant margins. 67% of consumers already prefer ordering directly from a restaurant’s own app or website. This has driven widespread adoption of direct ordering infrastructure, where restaurants keep 100% of revenue and own their customer data.