
"Deonde's team was fantastic in creating our own ordering app. It's made a real difference in how we operate, and our customers are finding it so convenient. Highly recommend their service!"Read Chowman Case Study →
Turn Your Restaurant Data into Decisions That Grow Revenue
Stop guessing which menu items drive profit or which delivery zones underperform. Deonde's analytics dashboard gives you real-time data across every order and customer.
- Real-time sales dashboard
- Customer behaviour insights
- Menu performance tracking
Real-Time
All data updated live as orders flow in
20+ Metrics
Across orders, customers, drivers & revenue
Custom Reports
Filter by date, branch, or category
Export-Ready
Download reports for any period
Trusted by 300+ brands worldwide










How It Works
From Raw Orders to Actionable Insights in Three Steps
Deonde captures, organises, and presents your restaurant data automatically — no manual data entry, no spreadsheets.
Orders Flow In
Every order placed — from any channel — is captured automatically with full data: item, price, time, customer, delivery zone, and payment method.
Data Is Organised
Deonde aggregates your order data into dashboards — sales by day, week, or month, top items, customer frequency, zone performance, and revenue breakdown.
You Make Better Decisions
Filter, compare, and export any report. Spot your best-performing items, busiest hours, and most profitable zones — then act on what the data tells you.
Analytics Features
Every Metric Your Restaurant Needs — In One Dashboard
From live order counts to monthly revenue trends, Deonde gives you the full picture of your restaurant's performance without opening a single spreadsheet.
Live Sales Dashboard
See today's revenue, order count, and average order value update in real time. Compare against yesterday, last week, or last month instantly.
Menu Performance Analytics
Know exactly which items sell most, which ones get abandoned, and which drive the highest revenue — by location and time period.
Customer Behaviour Insights
Track repeat customer rate, average order frequency, and customer lifetime value. Identify your most loyal customers and their ordering patterns.
Delivery Zone Performance
Analyse revenue, order count, and average delivery time per zone. Spot underperforming zones and adjust delivery fees or marketing accordingly.
Revenue & Order Trend Reports
View daily, weekly, and monthly revenue trends with comparison periods. Identify seasonal patterns and plan staffing, stock, and promotions accordingly.
Exportable Data Reports
Download any report — sales, orders, customers, or drivers — as a CSV for your own analysis, accounting, or external business reviews.
Who It's For
Built for Every Type of Food Business
Whether you run a single outlet or a multi-brand delivery platform, Deonde's analytics adapt to the scale and complexity of your operation.
Single Restaurants
Chain Restaurants
Cloud Kitchens
Food Delivery Startups
Multi-Vendor Platforms
Grocery Delivery Services
Quick Commerce Operators
Customer Stories
Real Stories from
Real Stories from
Founders Who Scaled with Deonde
See what our customers say about transforming their delivery business
"Starting our own delivery app felt overwhelming before Deonde. But they made it incredibly simple. We launched in less than a week, and our sales have grown significantly since then."Read HungryJi Case Study →
"Deonde has completely transformed how we handle orders. The admin panel gives us full control, and our customers love the smooth ordering experience. Best investment we've made."Read Munch Zimbabwe Case Study →
Why Deonde
Built for Business
Built for Business
Growth, Not Just Ordering
Everything you need to run a world-class delivery operation, included from day one
Easiest Usability
Intuitive dashboards your team can master in hours. No technical expertise required to get started.
Enterprise-Grade Security
Bank-level encryption, GDPR compliance, and monitored cloud hosting, with custom SLAs available for enterprise plans. Your data and your customers' data stays safe.
Better ROI
Zero commissions means every order goes directly to you. Most businesses recover their investment within the first month.
Constant Support
Dedicated onboarding team and 24/7 technical support. We're with you from setup to scale.
Periodic Updates
New features shipped every month. No extra cost, no downtime. Your platform evolves with market demands.
Access Anywhere
Manage your business from any device, anywhere. Full-featured web dashboard plus native mobile apps.
FAQ
Questions About Restaurant Data Analytics
Everything you need to know about Deonde's analytics dashboard and reporting features.
Deonde tracks all order data automatically — revenue, order count, average order value, menu item performance, customer frequency, delivery zone performance, driver performance, payment method breakdown, and more. All data is updated in real time as orders flow in, and can be filtered by date range, restaurant branch, or category.
Yes. If you operate multiple branches, Deonde's analytics dashboard lets you view data per location or across all locations combined. You can compare performance between branches, identify top-performing locations, and spot operational issues at specific sites.
The menu performance section of your Deonde dashboard shows total orders, revenue generated, and order frequency for every item on your menu. You can sort by top sellers, highest revenue generators, and most frequently reordered items — making it easy to optimise your menu and promotional focus.
Yes. All reports in Deonde are exportable as CSV files. This includes sales reports, order reports, customer reports, and driver reports. You can filter by any date range before exporting — making it straightforward to generate monthly or quarterly data for your accountant or business reviews.
Yes — the Deonde admin dashboard is fully responsive and accessible on mobile browsers. You can check your live sales, order counts, and key metrics from your phone at any time. The partner app also gives restaurant operators access to their own branch-level analytics.
Yes — Deonde offers full access to the analytics dashboard. No credit card required. You can start collecting data immediately and explore all reporting features before committing to a plan.
Further Reading on Restaurant Analytics
View all articles
How-To

Restaurant Analytics: How To Use Data For Better Business
how to leverage restaurant analytics to increase revenue & optimize operations. Discover key metrics, reporting tools & data-driven strategies for...
Marketing
How To Calculate ROI Of Food Delivery Software?
How to calculate the true ROI of food delivery software before committing. Real formulas, worked examples, and red flags to watch in contracts.
Blog
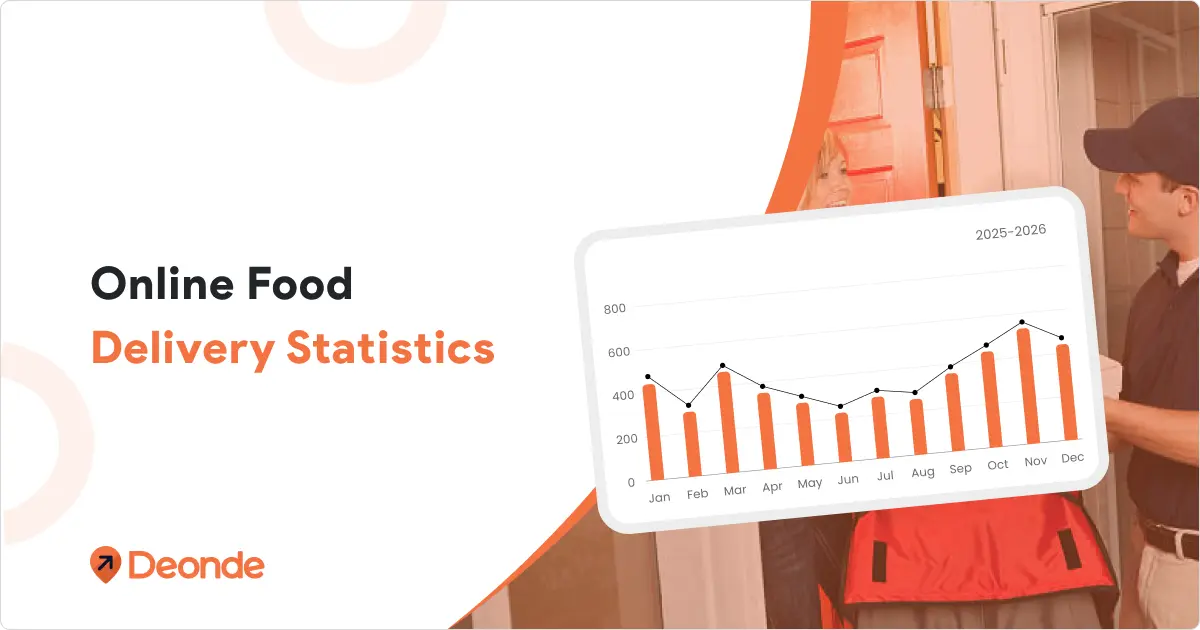
Online Food Delivery Statistics And Growth: Market Overview
Explore the latest online food delivery statistics for 2026 — global market size, consumer behavior, app market share, regional data, and key industry trends.